Infographic Design
Visualise your knowledge and data with a custom infographic design.
At DCP we create infographic designs to help visualise your knowledge and data.
Infographics can help improve your website engagement, increase your social media engagement and SEO rankings.
At DCP we create infographics to help visualise your knowledge and data. Infographics can help improve your website visitor’s engagement, increase your social media engagement and SEO rankings.
- Data visualisation
- Services visualisation
- Products visualisation
- Showcase your knowledge
- Reports and presentations
- Marketing and advertising
- How-to guides
- Create engaging content
- Share on social media
- Enhance blog posts
Infographic Designers
Showcase your knowledge with creative infographic designs and share them on your social media profiles and website blog.
Increase user engagement on social media and your website.
Infographic Design Features
Infographics can be used to showcase different aspects of your business. The goal is to condense information into an easy-to-understand visual format which helps your customers to better understand your services or products.
Use infographics to visualise informative business stats.
Use infographics to showcase your business services.
Use infographics to demonstrate your products.
Use infographics to showcase your knowledge and skills.
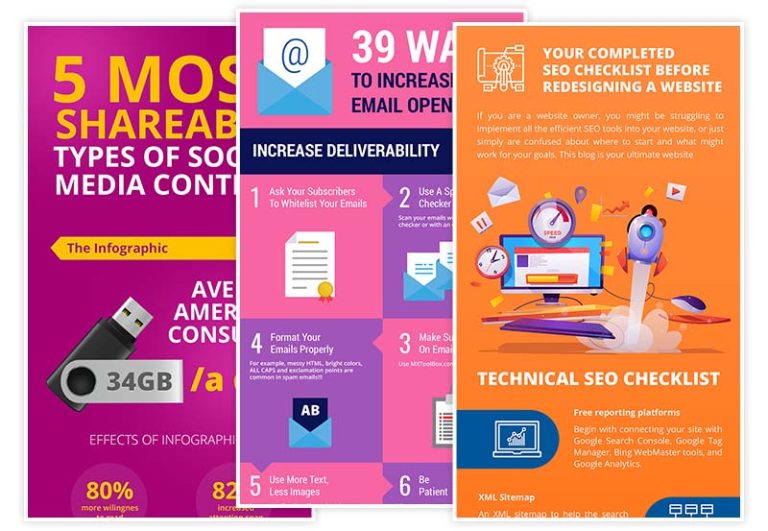
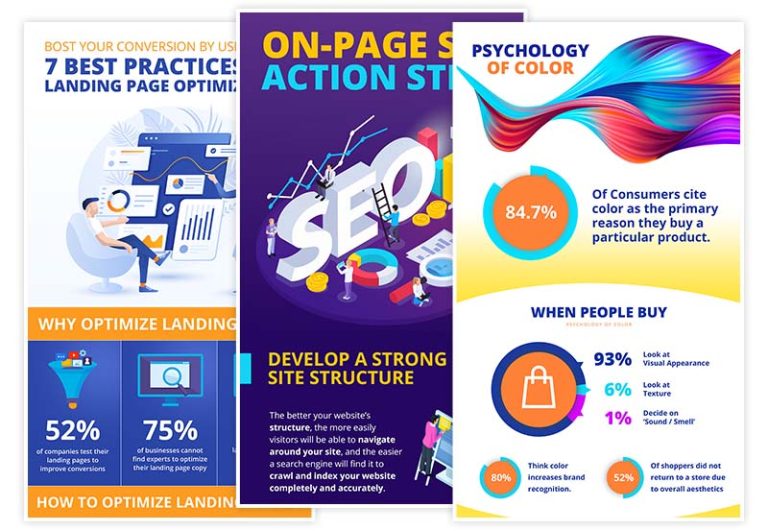
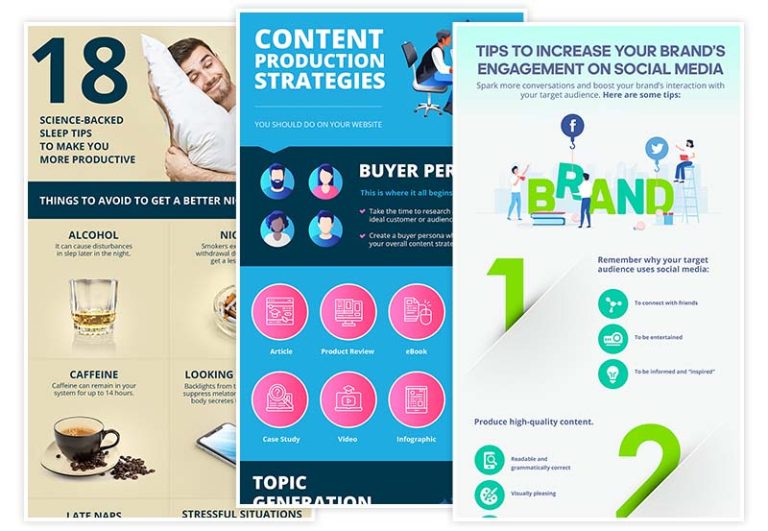
Infographic Design Showcase Projects
Below are just a few examples of infographic design projects we have completed.
- 20+ YEARS OF GRAPHIC DESIGN EXPERIENCE
- LONDON-BASED CREATIVE DESIGN TEAM
- ENGAGING VISUAL CONTENT WITH CLEAR, FAIR PRICING
- Your data is encrypted and never shared.
Last Updated: 01/07/2024
Different Colour Productions Ltd (“we,” “us,” or “our”) is committed to protecting your privacy. This Privacy Policy outlines our practices concerning the collection, use, and disclosure of personal information when you visit our website or engage with our services. By using our website and services, you consent to the terms outlined in this Privacy Policy.
1. Information We Collect
We collect various types of information to provide and improve our services. The types of information we may collect include:
1.1. Personal Information: This may include your name, email address, phone number, and any other information you provide when you contact us, request information, or subscribe to our newsletter.
1.2. Log Data: When you visit our website, we automatically collect information, such as your IP address, browser type, pages visited, and the time and date of your visit.
1.3. Cookies and Similar Technologies: We use cookies and other tracking technologies to improve your experience on our website. You can adjust your browser settings to reject cookies or be alerted when cookies are being used.
2. How We Use Your Information
We use the collected information for various purposes, including:
2.1. Providing Services: To provide web design and related services you have requested from us.
2.2. Communication: To respond to your inquiries, send updates, and provide customer support.
2.3. Analytics: To analyse and improve our website and services, as well as monitor usage patterns.
3. Information Sharing and Disclosure
We do not sell or rent your personal information to third parties. However, we may share your information with third parties under the following circumstances:
3.1. Service Providers: We may share your information with trusted service providers who help us deliver our services, such as hosting providers, analytics providers, and marketing services.
3.2. Legal Obligations: We may disclose your information when required by law, to comply with legal processes, or to protect our rights, privacy, safety, or property.
4. Your Choices
You have choices regarding your personal information:
4.1. Access and Update: You can access and update your personal information by contacting us.
4.2. Marketing Communications: You can opt out of receiving marketing communications from us by following the unsubscribe instructions in our emails or emailing info@dcpweb.co.uk
5. Security
We take appropriate measures to protect your personal information from unauthorised access, disclosure, alteration, or destruction.
6. Links to Other Websites
Our website may contain links to third-party websites. We are not responsible for the privacy practices of these websites. We recommend reviewing their respective privacy policies.
7. Changes to this Privacy Policy
We may update this Privacy Policy from time to time to reflect changes in our practices. Any changes will be posted on this page, and the date at the top will indicate the latest update.
8. Contact Us
If you have any questions or concerns about this Privacy Policy or our practices, please contact us at: info@dcpweb.co.uk
By using our website and services, you acknowledge that you have read and agree to this Privacy Policy. Different Colour Productions Ltd is committed to safeguarding your personal information and respecting your privacy rights.
Infographic Design Overview
We create infographics to improve customer engagement.
What is an infographic design
Infographics can be used to convey simple or complex information in a visual format which is easy to understand.
Infographic Design Overview
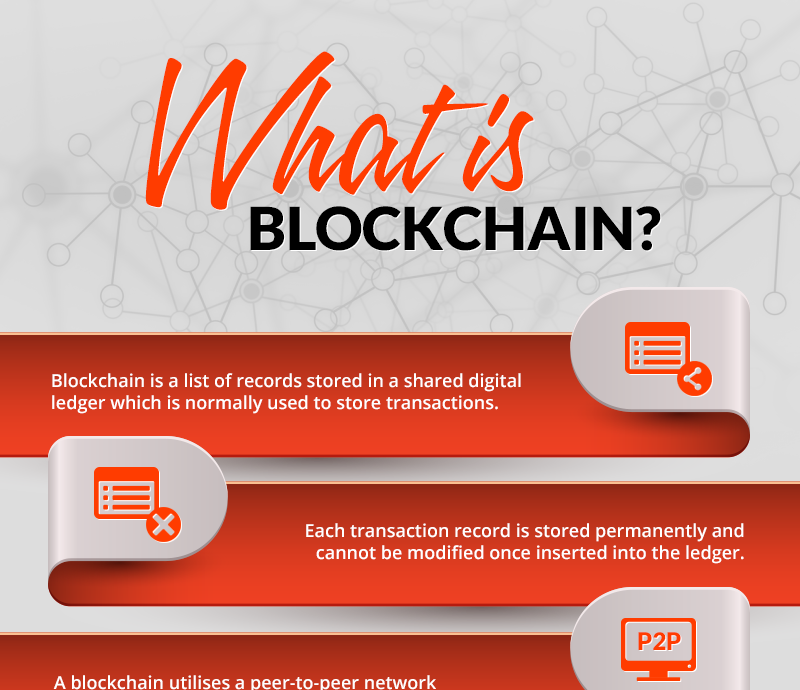
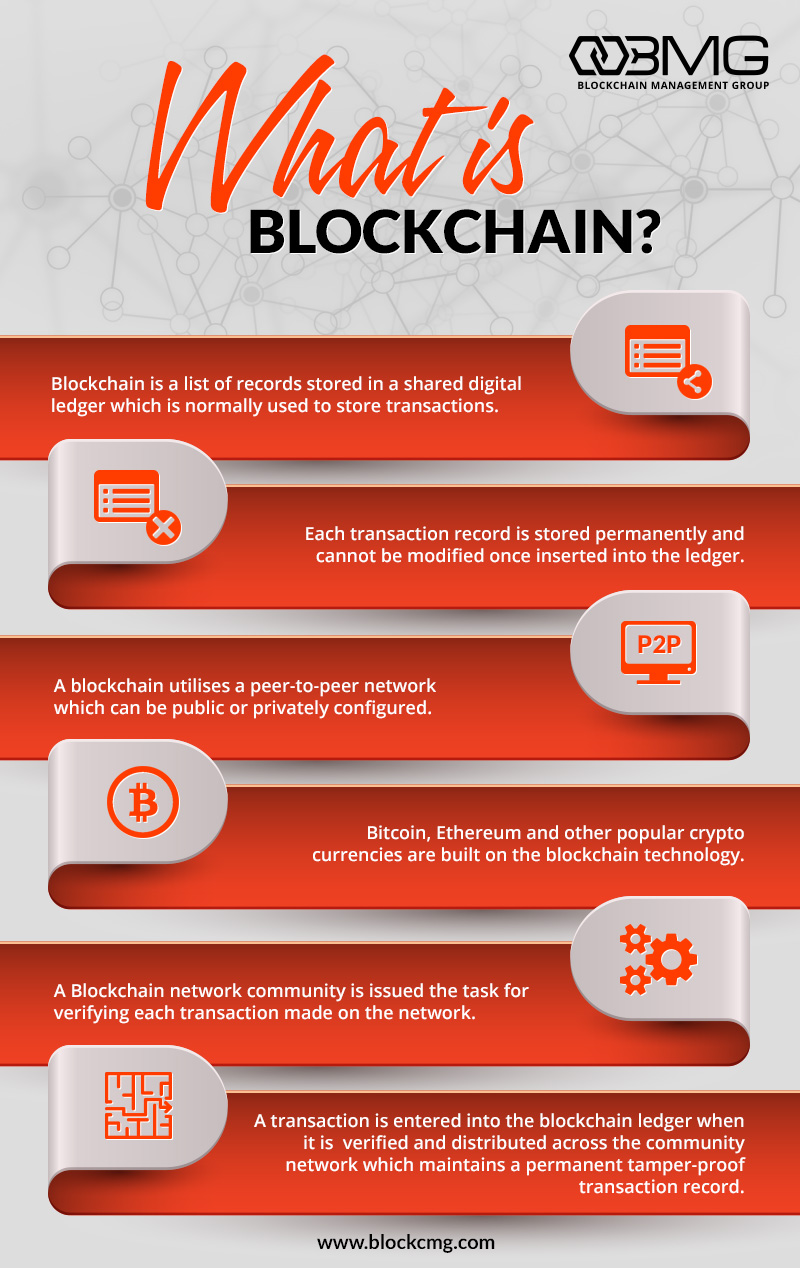
An infographic is a visual representation of information, data, or knowledge designed to convey complex ideas or concepts in a clear and easily understandable format.
Our infographic design combines text, images, icons, charts, and other graphic elements to present information in a concise and visually appealing manner.
The primary goal of an infographic is to make complex information more accessible and engaging to a broader audience.
Infographics are commonly used for a variety of purposes
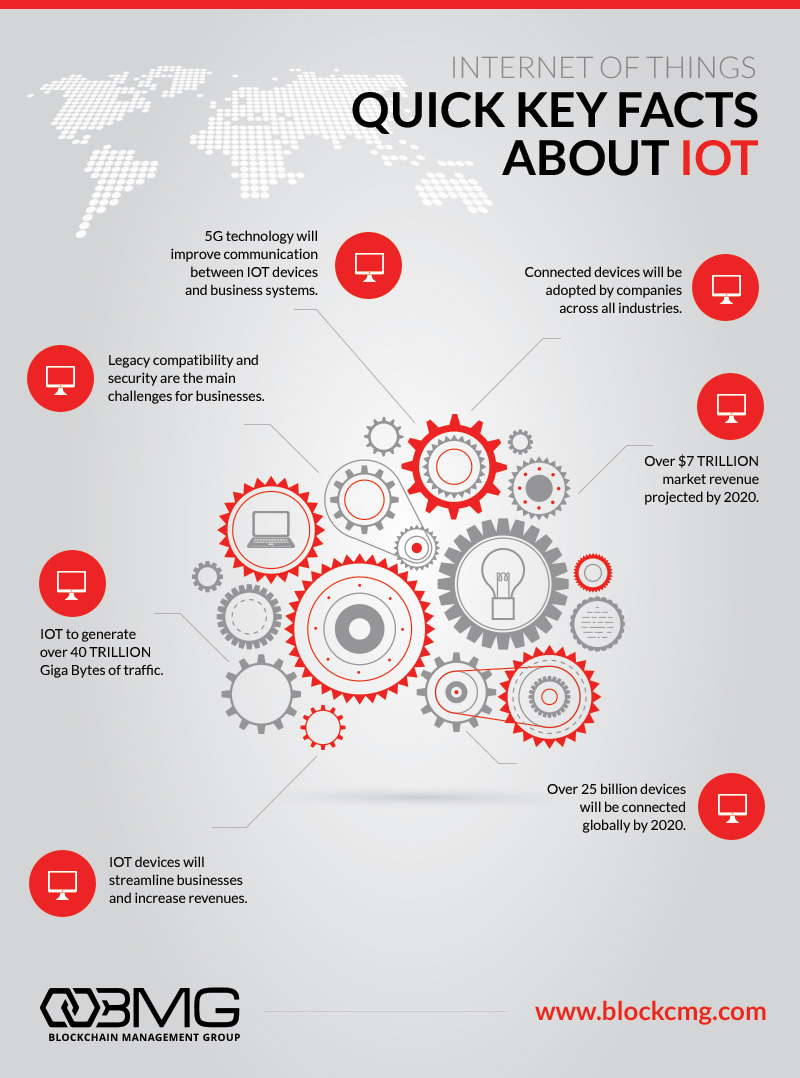
Data Visualisation: Infographics are often used to display data and statistics in a way that is easier to comprehend than raw numbers or tables. Bar charts, pie charts, line graphs, and other visual representations of data can be incorporated into infographics.
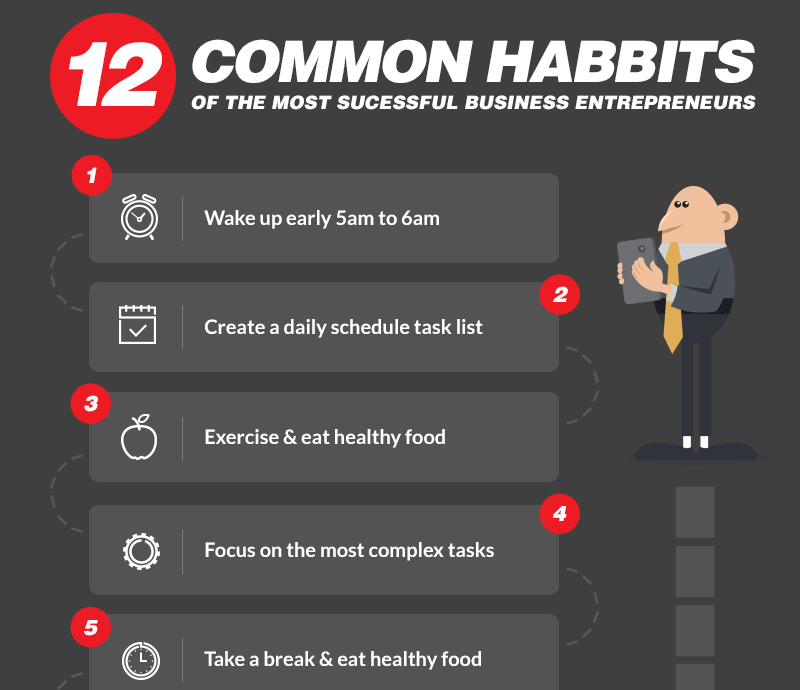
Educational Purposes: Infographics can be used in educational settings to simplify complex topics and make learning more engaging. Teachers and students often create infographics to summarise information for assignments or presentations.
Marketing and Advertising: Your business can use infographics to convey information about products or services, showcase industry trends, or present research findings in a visually appealing manner. The infographics can be shared on social media, websites, and marketing materials.
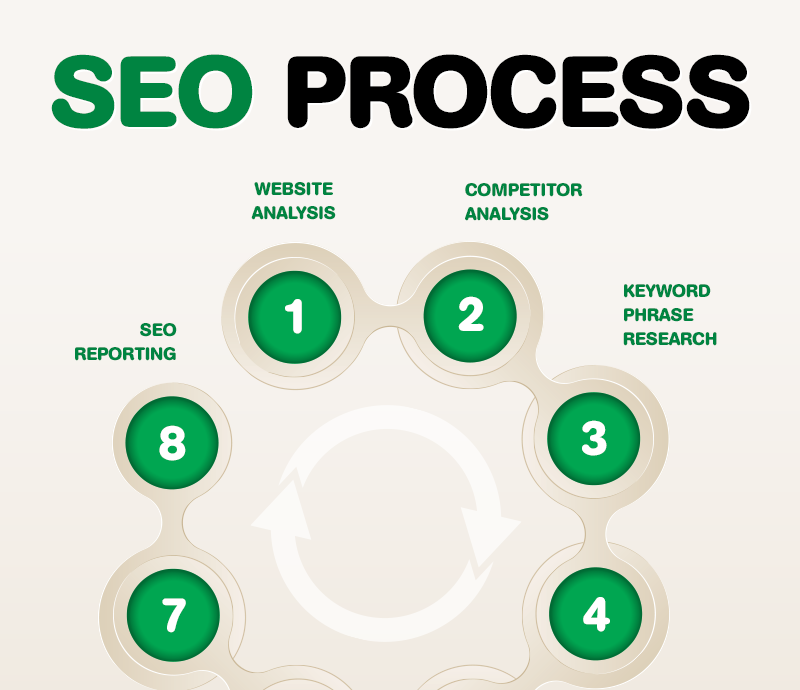
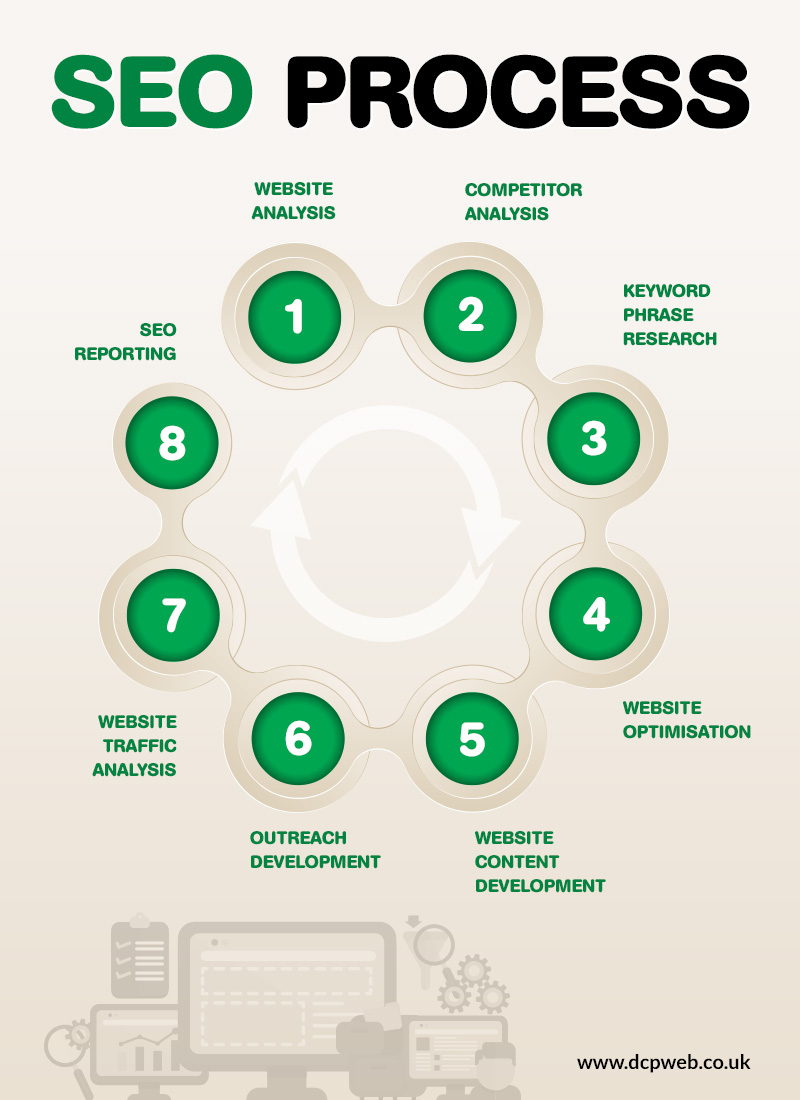
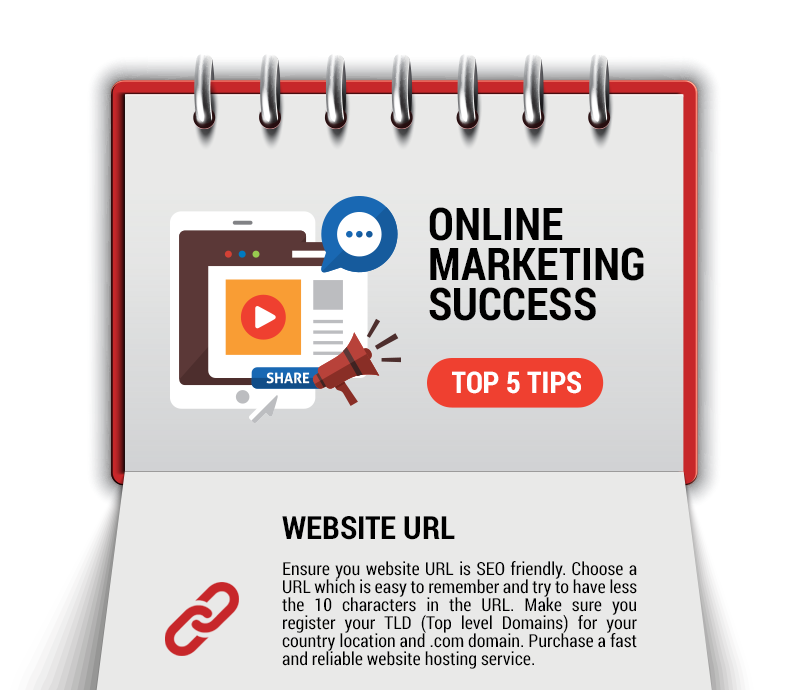
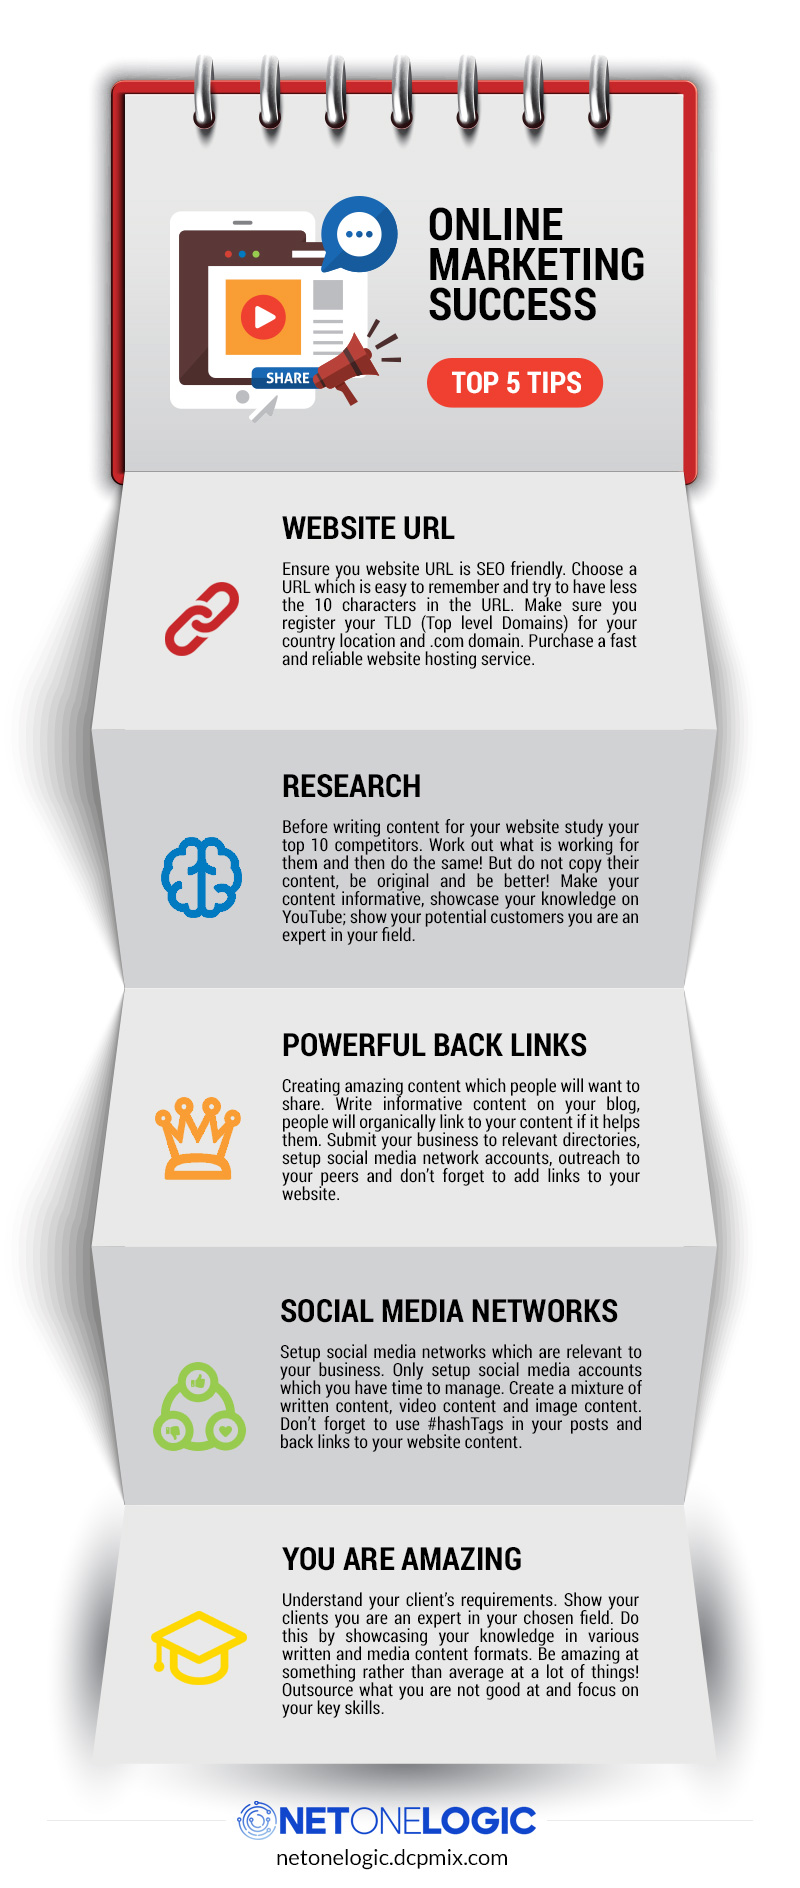
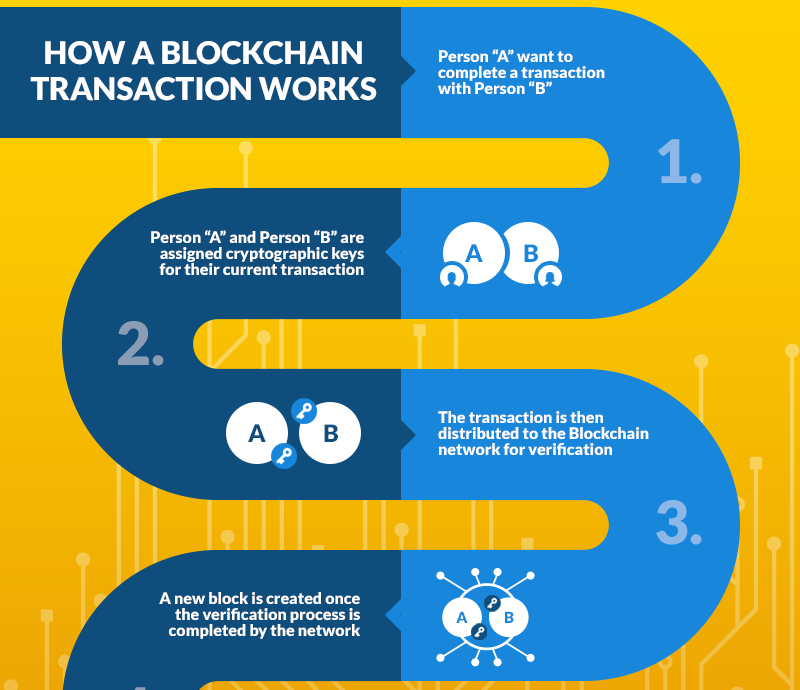
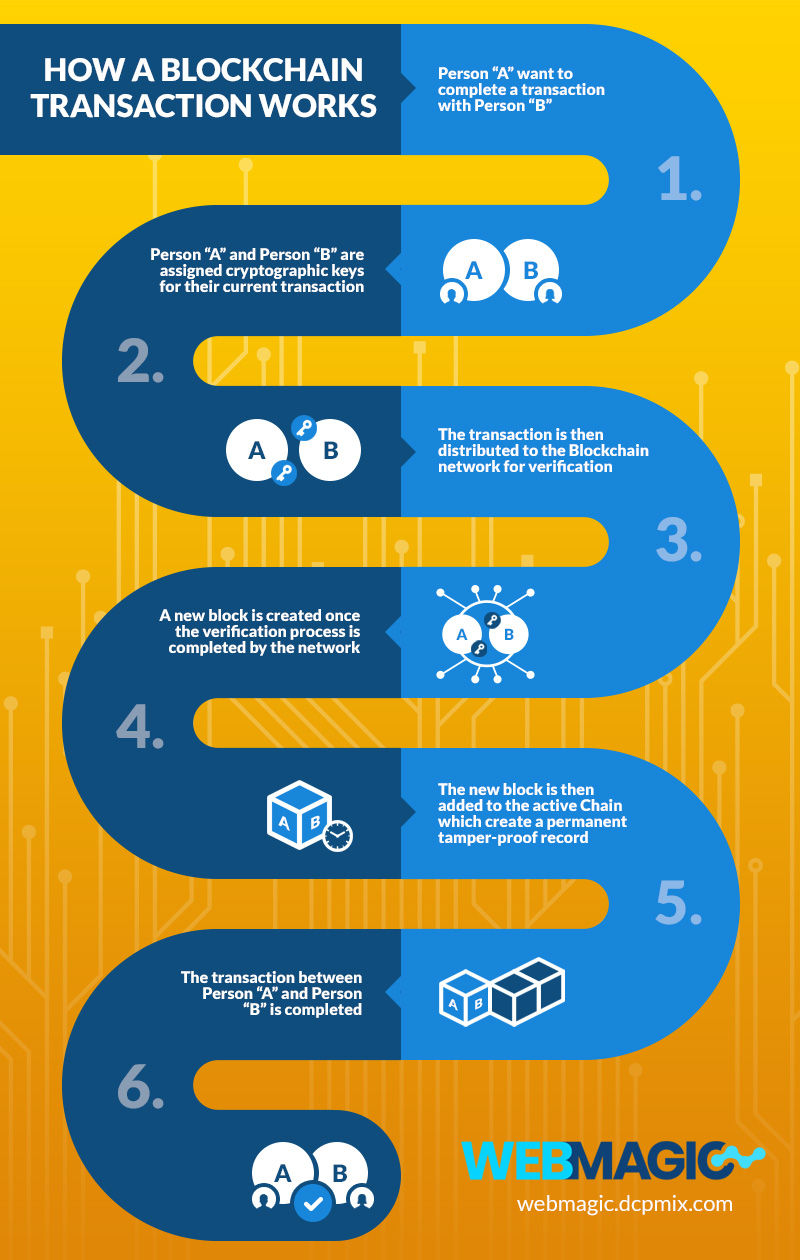
Explaining Processes: Infographics are effective for breaking down complex processes or workflows into step-by-step visual guides. This can be helpful in technical documentation, user manuals, or instructional materials.
Comparisons: Infographics can be used to compare and contrast different options or scenarios, making it easier for readers to make informed decisions about your products or services.
Storytelling: Some infographics are designed to tell a story by presenting information in a chronological or narrative format. This is often seen in timelines and historical infographics.
Awareness Campaigns: Infographics can be used to bring awareness of new products or services you provide.
infographic design services
Infographics come in various styles, from simple and minimalistic designs to more elaborate and artistic creations.
The choice of design elements, colours, typography, and layout depends on the intended audience and the message you want to convey.
The key is to balance visual appeal with the effective communication of information.
Contact DCP today for a free Infographic Design quote.
Infographic Sharing Platforms
There are many platforms where you can share your infographic to improve visibility and user engagement.
Infographic Sharing Platforms Overview
There are platforms dedicated to sharing and discovering infographics, such as Pinterest, elearning Infographics, Daily Infographic and Slide Share You can upload your infographic to these platforms to reach a broader audience interested in visual content.
You can use file-sharing services like Dropbox or Google Drive to upload your infographic and then share it.
If you have a website or blog, you can publish the infographic as a blog post or as part of an article. Embed the infographic within the content, and provide an explanation or context around it.
Social media platforms like Facebook, Twitter, Instagram, LinkedIn, Pinterest, and others are popular for sharing infographics.
You can attach the infographic to an email and send it directly to your contacts or mailing list. Ensure that your email subject line and message clearly convey the importance of the infographic.
What is a business educational infographic
Educational infographics are great for sharing knowledge about your business, services or products.
Educational Infographics Overview
A business educational infographic is a visual representation of information designed specifically to convey educational content in a clear and engaging manner.
These infographics are created with the primary goal of facilitating learning and understanding of a particular topic or subject.
Key characteristics of educational infographics
Content Focus: Educational infographics typically focus on conveying knowledge, facts, concepts, or processes related to a specific subject or topic. This can be related to your business, services or products.
Visual Clarity: These infographics use visual elements such as charts, graphs, diagrams, illustrations, icons, and images to make complex information more accessible and easier to grasp. Visual cues are carefully designed to support the educational content.
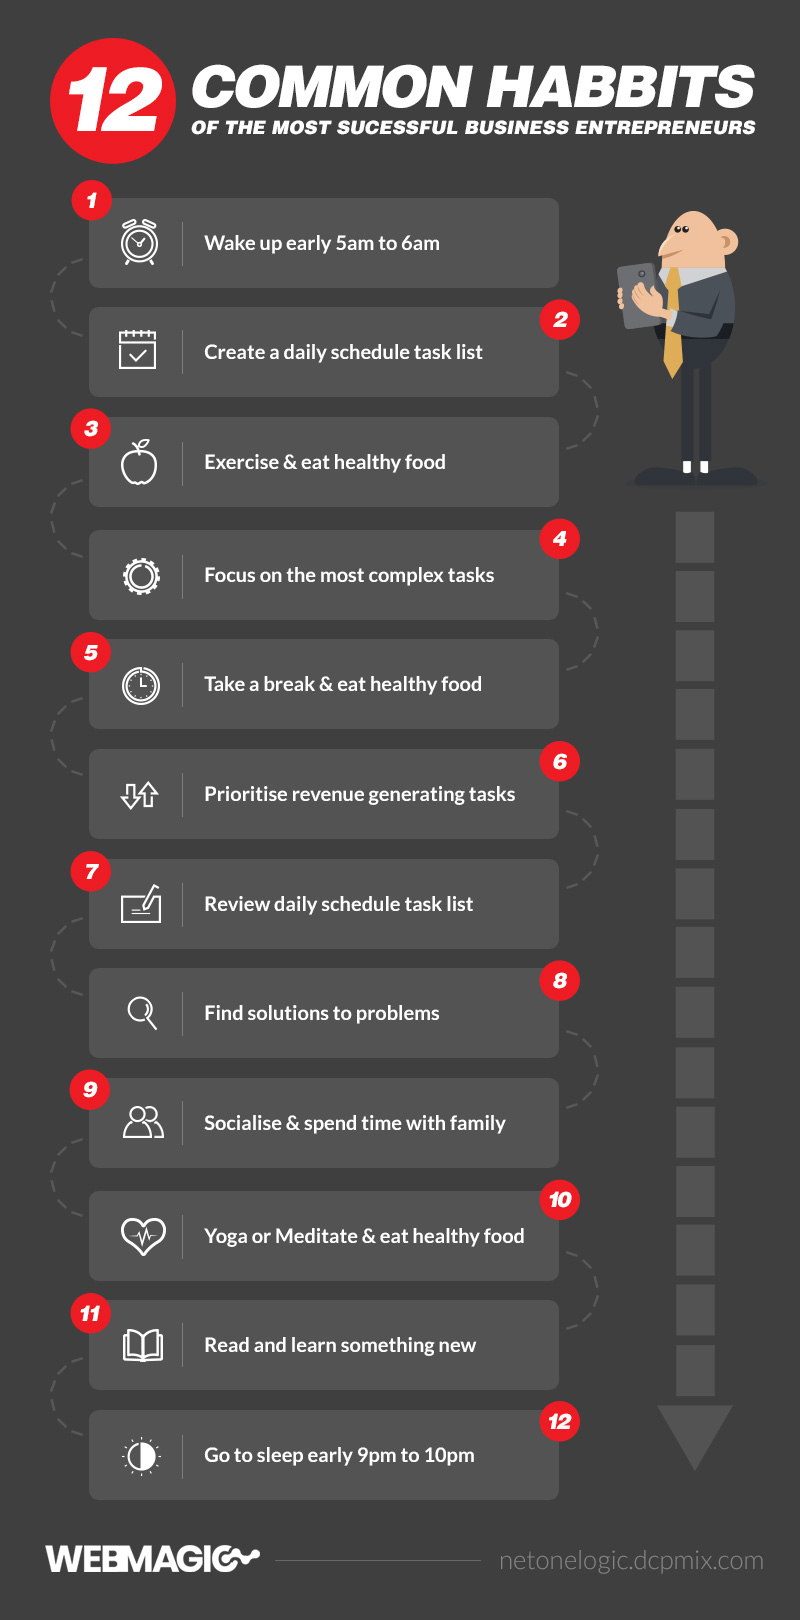
Simplicity and Structure: Educational infographics aim for simplicity and clarity in their design and organisation. Information is often presented in a structured and sequential manner to guide learners through the content.
Engagement: To engage learners effectively, educational infographics often incorporate colours, typography, and layouts that are visually appealing. The use of relevant visuals and a balanced design can make the information more memorable.
Interactivity: Some educational infographics may be designed to be interactive, allowing users to click, hover, or interact with different elements to explore the content further. This can enhance the learning experience by encouraging active participation.
Alignment with Learning Objectives: Educational infographics are created with specific learning objectives in mind.
Examples of business educational infographics
- A product infographic illustrating the key benefits.
- A services infographic detailing the key features and related costs.
- A history infographic about your business's past and future.
- A language infographic to target customers in other locations.
Infographic design agency
Educational infographics are valuable tools for businesses because they break down complex topics into digestible visual formats.
They can make learning more engaging and effective by providing a visual summary of important information, reinforcing key concepts, and aiding in the retention of knowledge.
Contact us if you are looking for an expert infographic designer.
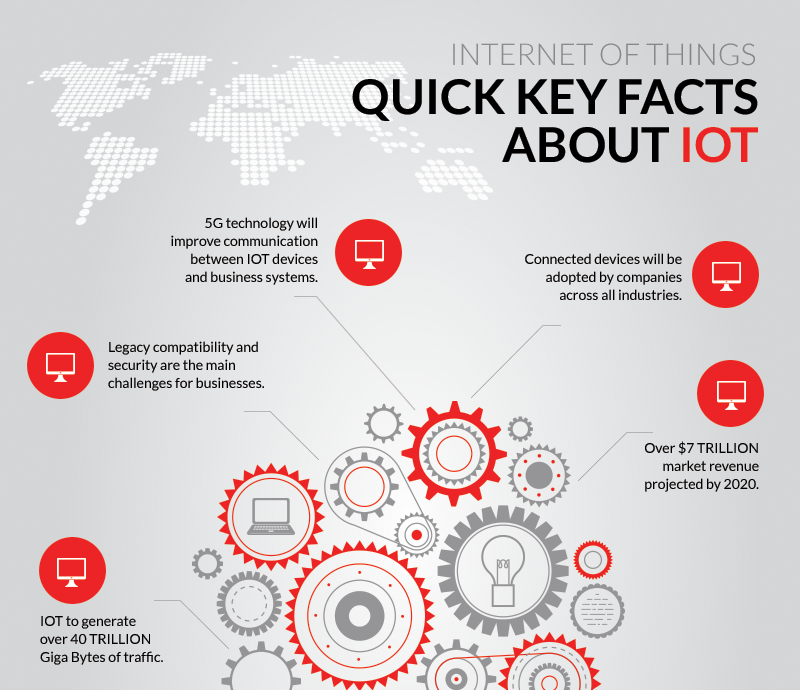
What is a business data infographic
Represent your business data in a visual format to improve internal and external engagement.
Business Data Infographic Overview
A business data infographic is a visual representation of data and information related to your business, service or product.
These infographics are designed to convey key facts, statistics, trends, and insights in a visually engaging and easily understandable format.
Business data infographics are commonly used for various purposes within the corporate world, including marketing, reporting, presentations, and decision-making.
Key characteristics of business data infographics
Data Presentation: The primary focus of a business data infographic is to present data and information related to a specific business topic or industry. This data can include financial figures, market research results, customer demographics, sales trends, and more.
Visual Elements: Business data infographics rely on visual elements such as charts, graphs, tables, icons, illustrations, and images to represent the data effectively. Visual elements are chosen and designed to enhance comprehension and engagement.
Storytelling: Effective business data infographics often tell a story or convey a narrative by arranging data points in a logical and sequential manner. This storytelling approach helps the audience understand the context and significance of the data.
Branding: Business data infographics often incorporate the company's branding elements, such as logos, colours, and fonts, to maintain brand consistency and make it clear that the information is related to the business or organisation.
Clarity and Simplicity: Clarity is crucial in business data infographics. The information should be presented in a simple, concise, and organised manner, making it easy for viewers to grasp the main points quickly.
Audience Consideration: The design and content of business data infographics should be tailored to the specific audience's needs and knowledge level. They can be created for internal teams, stakeholders, customers, or the general public.
Call to Action: In some cases, business data infographics may include a call to action (CTA) to encourage viewers to take a specific action, such as visiting a website, signing up for a newsletter, or making a purchase.
Business data infographics include
- A financial infographic presenting a company's annual revenue and profit growth over the years.
- A market research infographic displaying customer demographics and preferences in a particular industry.
- A sales performance infographic illustrating sales trends and top-selling products.
- A competitive analysis infographic comparing a business's offerings to those of its competitors.
- An annual report infographic summarising key highlights and achievements of a company's fiscal year.
Business infographic design services
Business data infographics are valuable tools for businesses because they make complex data and information more accessible and memorable.
They can be used for internal communication, external marketing, investor relations, and strategic decision-making.
When well-designed, these infographics can help businesses convey their strengths, achievements, and value propositions effectively.
Contact DCP if you need business infographic design services.
Infographic Designers
10 years of creating infographic designs.
Infographics can help you convey a story or message to potential customers using a visual format.
You can incorporate key information about your products or services. They can also be used to showcase your expertise or simplify complex information into an understandable format.
Infographics can be shared on your business blog, newsletters or popular social media platforms.
If you need a professional infographic designer to improve your business marketing assets, then simply contact DCP Graphic Designers today at 07838 678 770 or 0203 539 4415.
Latest Graphic Design Blog Post
Start learning something new today!
Free access to over 500+ video tutorials, Infographics and Articles.

- Articles, Artificial Intelligence - AI, Website Design
- Articles, Business Tips, Website Design
- Articles, Website Design

- Articles, Website Design

- Articles, Website Design
- Articles, Graphic Design, Website Design